
User-Friendly Interface
Drag-and-Drop Layout Creation
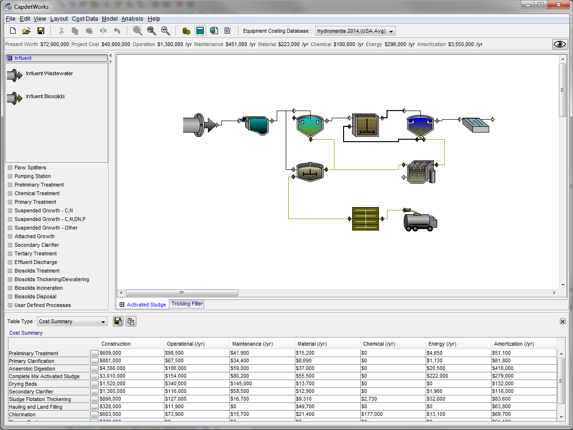 Simply drag-and-drop unit processes to build a plant schematic with CapdetWorks and it will design the plant and estimate the costs to build, operate and maintain the facility.
Custom Connection Paths with Highlighting – Customize the unit process connection paths for cleaner layouts. Hovering the mouse over a connection path will cause it to turn red to better highlight the connectivity especially in larger layouts.
Coloured Connection Lines – To enhance the ability to quickly understand the flow diagram, the connection lines on the drawing board are colour-coded depending on the type of stream (wastewater or sludge). The colours are editable in the user preferences.
Compare Alternatives
 Quickly and easily building multiple treatment alternatives to compare relative costs.
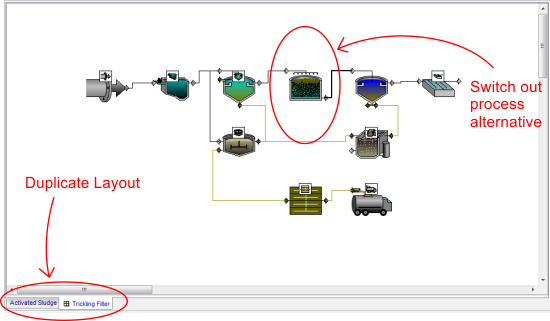
Build your layout – Create the original layout by drag-and-dropping the processes onto the drawing board and defining the connection streams.
Duplicate the layout – Go to ‘Layout->Duplicate’ to create an exact copy of the layout on a new tab. The unit processes on the duplicated tab with be ‘sourced’ back to the original layout so that any changes to the input parameters will be automatically propagated to the duplicate layout.
Switch out the alternative process – Delete and replace the desired unit process with it’s alternative.
Cost and compare – Cost both layouts at the same time and compare the differences side-by-side.
Reporting Wizards and Dashboards
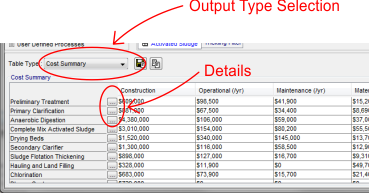 Report wizards, on-screen summary dashboards and easy export to Excel saves time when viewing and analyzing CapdetWorks results.
CapdetWorks’ reporting feature allows users to export costing data, layout schematics, and process data into three different file formats, depending on your preference. The report can be created as a Microsoft Excel spreadsheet, a Rich Text Format document (which can be opened in most word processing programs including Microsoft Word) or simply as plain text.
Sensitivity Analysis
Perform “What-if” Scenarios
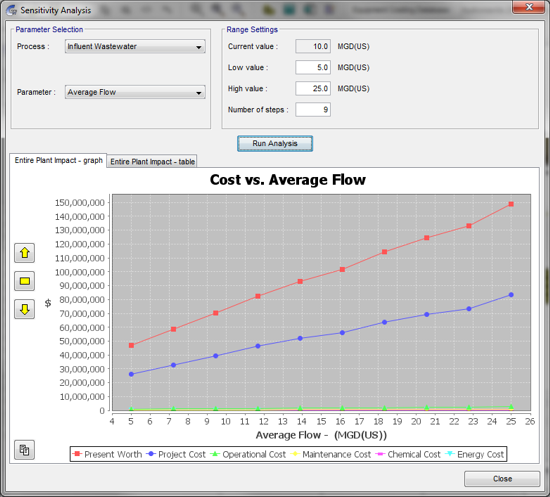
Easily evaluate and identify critical factors by varying various input parameters and viewing their impact on the overall plant cost (or individual unit process cost).
- Select the unit process and input parameter.
- Set the lower and upper extremes that you’d like to analyze.
- Run the analysis and view the results in a graphical or tabular format.
- If required, export the data to Excel for further analysis or to add to a report.
Equipment and Unit Costs
 CapdetWorks uses a unit costing approach which features an extensive costing database. Our unit costs are carefully researched based on discussions with manufacturers, suppliers, and consultants.
Use the existing databases, modify them to fit your needs or even create your own region specific database to customize the results to your unique requirements.
The effects of inflation are included and easily updated, using cost indices.
System Requirements
Windows 7,8
512 MB of RAM or more
250 MB of free disk space